
How to Look Up King County Jail Population Data
The source for population data is the Department of Adult and Juvenile Detention. It posts detention and alternatives reports, often called scorecards, that summarize monthly and year-to-date figures. These reports are where the official numbers live, and they update on a regular schedule rather than minute by minute. Reading them tells you how full the jails are, how many people come and go, and how long they stay.
This is population data, not a case lookup. The reports do not name individuals. They count beds and days. For policymakers, researchers, and reporters, that aggregate view is exactly the point, since it shows the size and shape of the system rather than any one case.
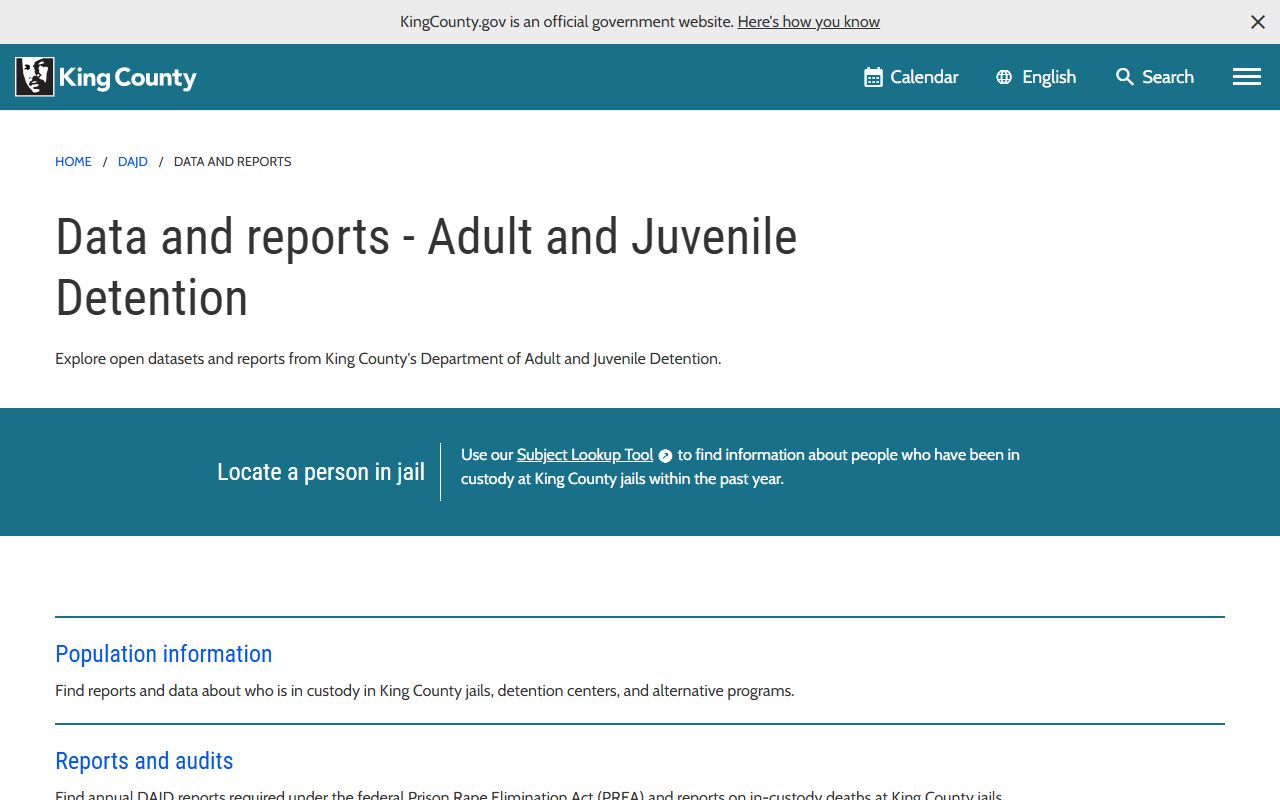
The DAJD data and reports page hosts the population information and the reports and audits links.
A scorecard packs several measures into one report. The key terms are worth knowing before you read one. Bookings count people entering custody. Releases count people leaving. ADP measures the average number held each day. Length of stay measures how long people remain. Each measure is reported for secure custody, for Electronic Home Detention, and as a combined total, which lets you see both the jail beds and the broader custody system in one view. Reading the same measure across several months shows the direction the population is heading.
King County Average Daily Population
Average daily population, or ADP, is the mean number of people in custody each day over a period. The county calculates it as total inmate days divided by the number of days in the period. The table shows the 2025 year-to-date figures through August for each part of the custodial system.
| Population Measure | 2025 YTD ADP (through August) |
|---|---|
| King County Correctional Facility (KCCF) | 794.2 |
| Maleng Regional Justice Center (MRJC) | 624.3 |
| Total secure custody | 1,418.5 |
| Electronic Home Detention (EHD) | 371.6 |
| Total custodial population | 1,790.2 |
The downtown Seattle jail carries the larger share of secure custody, and the Kent facility carries most of the rest. Home detention adds several hundred more people who are supervised but not housed in a cell. Monthly figures move within a narrow band. Through 2025 the KCCF average held in the high 700s to low 800s, and the MRJC average held in the low to mid 600s, so the combined secure total stayed close to 1,400 across the reporting months. Those steady numbers reflect a system that books and releases at nearly the same pace.
Bookings and Releases
Bookings and releases show the flow through the jails. In a typical month the county books and releases well over a thousand people, and the two numbers stay close, which keeps the daily population fairly steady. The table shows the 2025 year-to-date totals through August.
| Measure | 2025 YTD (through August) |
|---|---|
| Secure bookings | 11,680 |
| EHD bookings | 319 |
| Total bookings | 11,999 |
| Secure releases | 11,297 |
| EHD releases | 664 |
| Total releases | 11,961 |
Across the first eight months of 2025 the county recorded close to 12,000 bookings and a similar number of releases, which is why the average daily population moves only a little month to month.
Secure Custody vs Electronic Home Detention
The county counts two kinds of custody, and they behave very differently. Secure custody means physical confinement in a 24-hour detention facility at KCCF or MRJC. Electronic Home Detention is custodial supervision in the community, not a jail cell. Both count as custody, but only secure custody fills a bed.
| Secure Custody | Electronic Home Detention |
|---|---|
| Held in KCCF or MRJC | Supervised in the community |
| 2025 YTD ADP of 1,418.5 | 2025 YTD ADP of 371.6 |
| Shorter average length of stay | Much longer average length of stay |
| Counts toward jail capacity | Does not occupy a jail bed |
Together the two make up the total custodial population, which stood at about 1,790 in the 2025 year-to-date figures.
Average Length of Stay
Length of stay measures how long people remain in custody. The two kinds of custody differ sharply. Through August 2025 the secure average length of stay was about 33.8 days year to date, while the Electronic Home Detention average was much longer, around 128 days year to date. That difference makes sense, since secure beds turn over quickly as people are booked and released, while home detention placements run for longer terms. The total average length of stay across both, blending the two, was roughly 41.5 days year to date. These averages move month to month, so any single month can run higher or lower than the year-to-date figure.
King County Jail Capacity Overview
Capacity tells you how the population compares to the space available. The official maximum capacity for KCCF and MRJC is not published on the county pages reviewed, so the most reliable way to gauge crowding is to track ADP against the county's own reports over time. The population figures above are the dependable numbers; a single fixed capacity figure should be confirmed with the county before it is relied on.
Note: Official maximum-capacity figures for the King County jails were not found in the public reports reviewed, so ADP is the best available measure of jail population.
Demographic and Pretrial Breakdowns
Detailed breakdowns by demographics, by pretrial versus sentenced status, and by misdemeanor versus felony are not broken out in the public scorecards reviewed here. The county's data and reports page is the place to look for any expanded breakdown, since DAJD periodically publishes additional reports and audits. When a breakdown is not published, it is better to say so than to estimate, because guessed percentages can mislead.
What the data does show clearly is the split between secure custody and home detention, the steady flow of bookings and releases, and the average daily population at each facility. Those are the figures the county reports consistently. If you need a pretrial-versus-sentenced split or a felony-versus-misdemeanor count for a research or policy purpose, request it from the county or watch for an expanded report. Treating a published number as the limit of what is known, rather than filling gaps with estimates, keeps the picture accurate.
National and State Context
County jail populations are usually compared using a rate per 100,000 residents, drawing on national sources such as the Bureau of Justice Statistics and research groups that study incarceration. A precise King County rate per 100,000 is not stated in the county reports reviewed, so it should be calculated from current population and ADP figures rather than asserted here. The takeaway holds up without a single ratio: King County runs one of the largest local detention systems in Washington, with an average secure population in the low 1,400s and a total custodial population near 1,800 in 2025. As the most populous county in the state, King County would be expected to hold one of the largest jail populations, and the figures bear that out. For a fair comparison with smaller counties or with national averages, the rate per resident matters more than the raw count, which is why the per-100,000 calculation is the standard tool when it can be computed from current data.
Population Trends Over Time
Trends are best read from the county's own series of reports. Older detention reporting put the year-to-date average secure ADP around 1,472 and a total custodial figure near 1,522 in an earlier year. The 2025 through-August report shows total secure ADP of 1,418.5 and total custodial population, including home detention, of 1,790.2. The most useful trend line comes from comparing DAJD monthly and annual reports directly, rather than mixing in third-party estimates that may use different definitions.
Reading several reports in a row shows how the system responds to court backlogs, policy changes, and seasonal booking patterns. The county has publicly discussed criminal caseflow and family-law backlogs in recent years, and those pressures show up in the population numbers over time.
Policy choices also move the line. In 2025 the county approved a Safe and Stable Communities measure aimed at criminal justice, behavioral health, and public safety, and the prosecutor paused a youth felony diversion referral program pending further review. Decisions like these can shift how many people are booked, how long they stay, and how many move to alternatives such as home detention. That is why the trend line is most honest when it is built from a run of official reports rather than from any single month.
Searching for King County Inmate Records by Name
Population data and individual records are two different searches. This page covers the counts. To find a specific person in custody, use the jail roster instead. The DAJD Subject Lookup Tool searches by name or booking number and shows the facility and custody status for adults held within the past year. Full instructions are on the inmate records page, and release searches are on the released inmates page. The roster answers who, where, and when for one person, while the scorecards answer how many for the whole system. Keeping the two searches separate saves time, because the population reports will never name an individual and the roster will never total the population.
Where the King County Population Data Comes From
All of the figures here come from the Department of Adult and Juvenile Detention, which operates the jails and publishes the reports. The same department runs the jail contact and visit services, so its pages are the hub for both population data and family contact information.
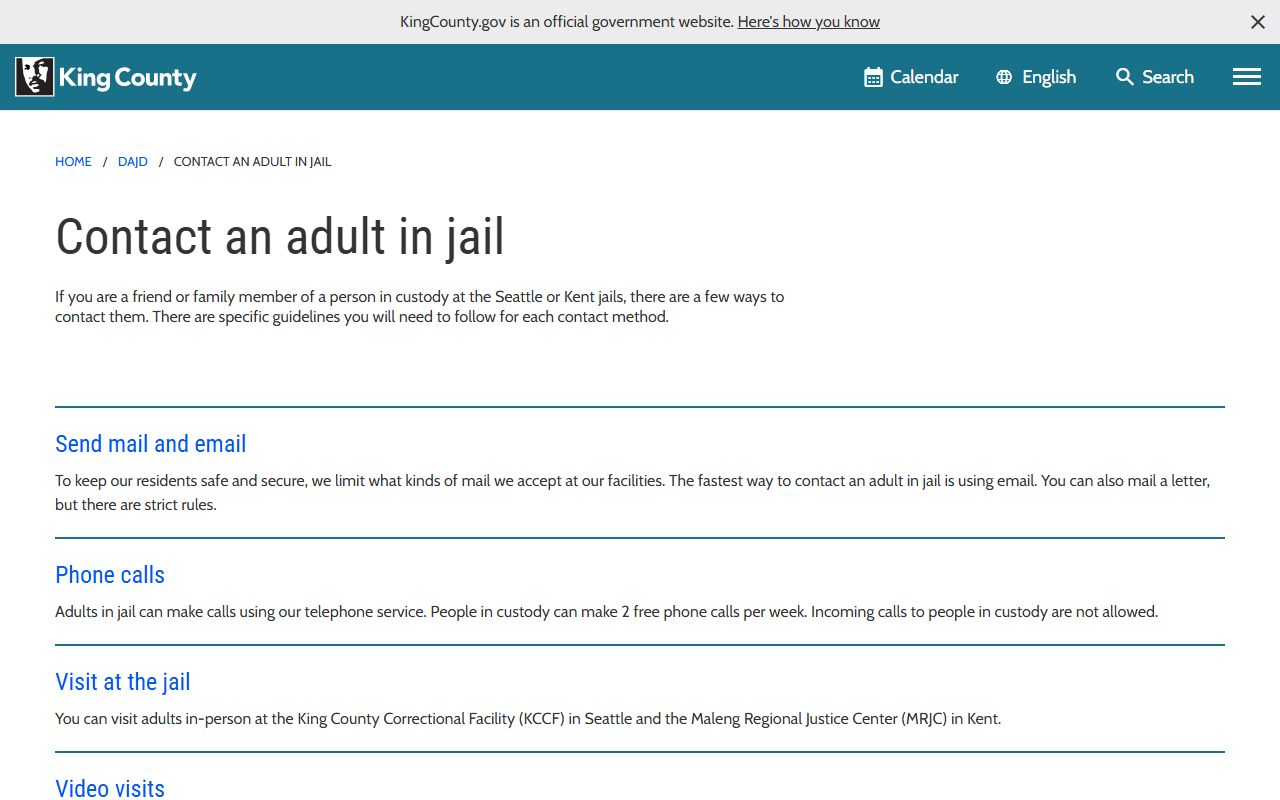
The adult jail contact page links the tasks families use most, while the data and reports page holds the population scorecards. For the courts behind the bookings, see court records and arrest records.